Back
24 Dec 2021
GBP/USD Price Analysis: Bears are moving in and eye the daily Fibos
- GBP/USD bears are taking control from weekly resistance.
- The weekly W-formation is a compelling reversion pattern.
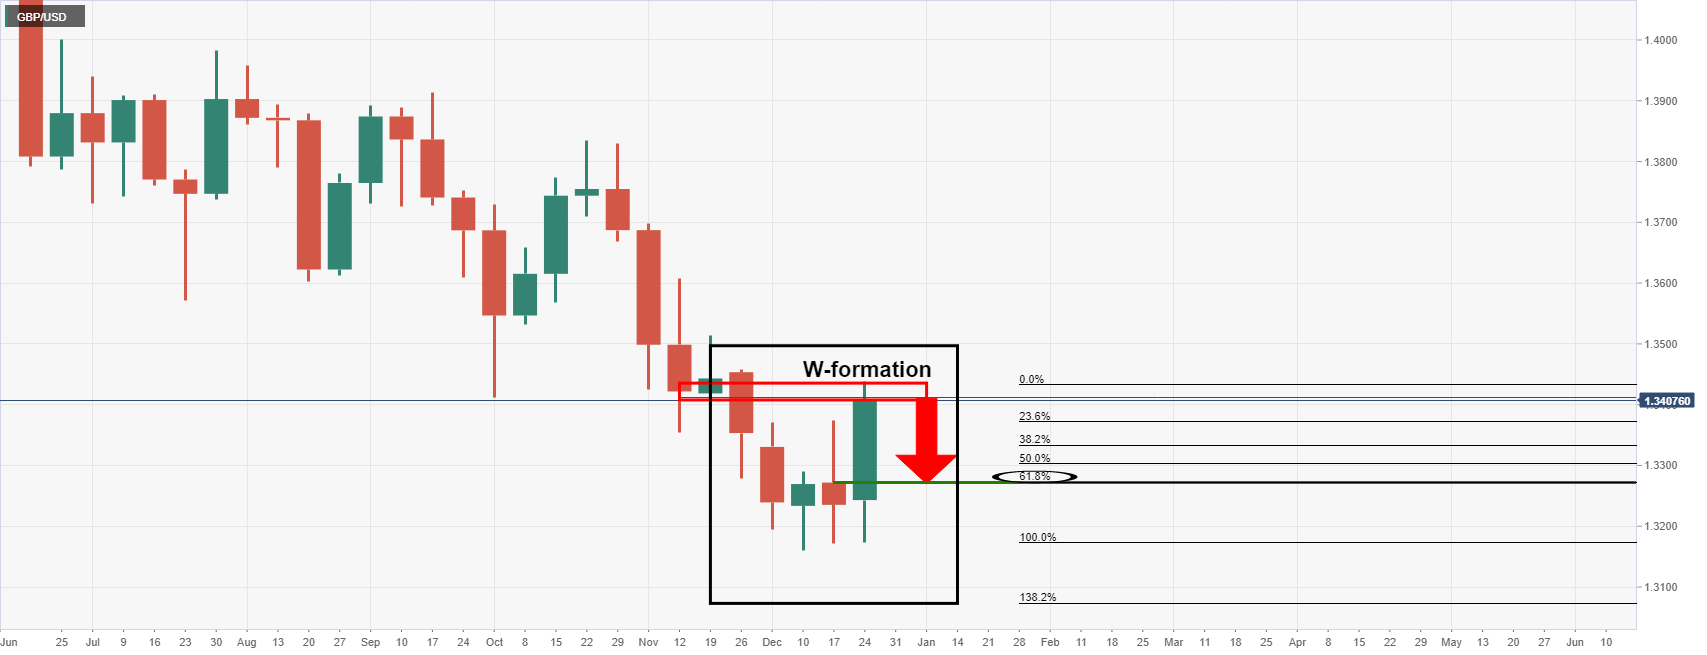
GBP/USD has started to consolidate on the longer-term time frames which leave the downside exposed for the forthcoming days as per the following analysis of the weekly chart.
GBP/USD weekly chart
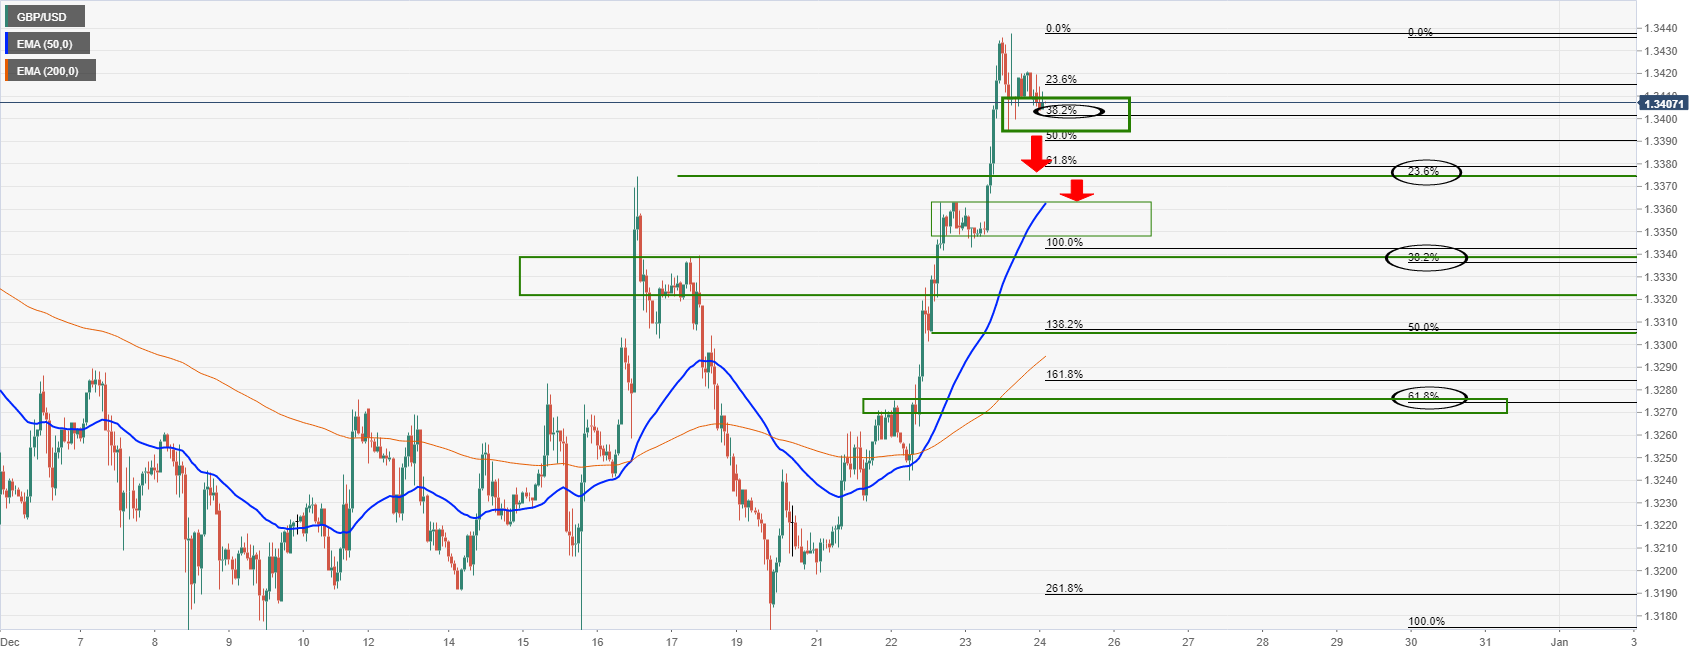
The hourly chart revealed a series of support structures on the way to the W-formation's neckline on the weekly chart above.
GBP/USD H1 chart
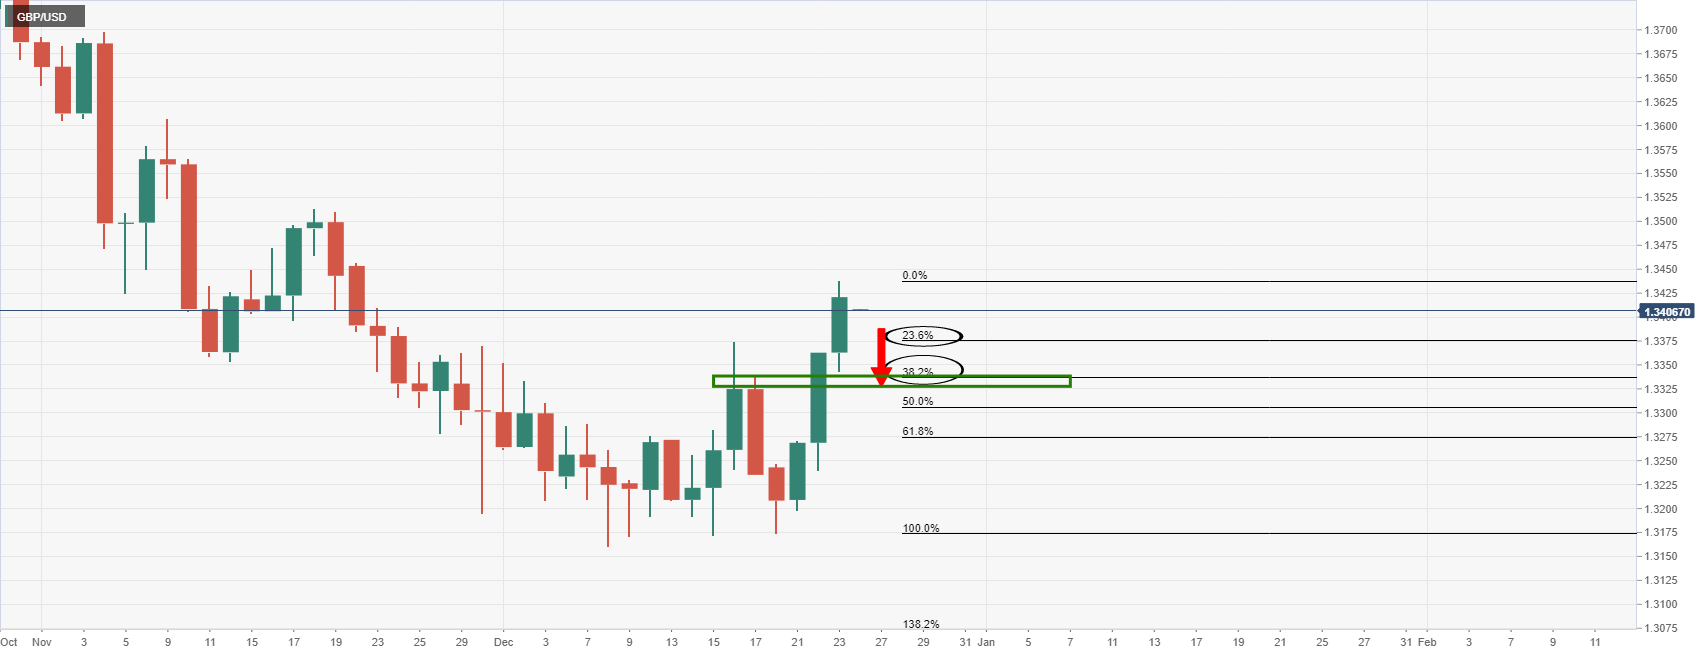
On the way to the weekly chart's W-formation's neckline, near 1.3270, the bears first need to breach 1.3380 and then 1.3340 as the daily chart's 23.6% and 38.2% Fibonacci retracements:
GBP/USD daily chart