Back
25 Mar 2020
Oil Price Analysis: WTI hovering near multi-year lows, sidelined near $24 a barrel
- WTI suffered one of its largest selloff in history plummeting to near $20 a barrel in the last weeks.
- WTI is stabilizing after the collapse however remains vulnerable to the downside.
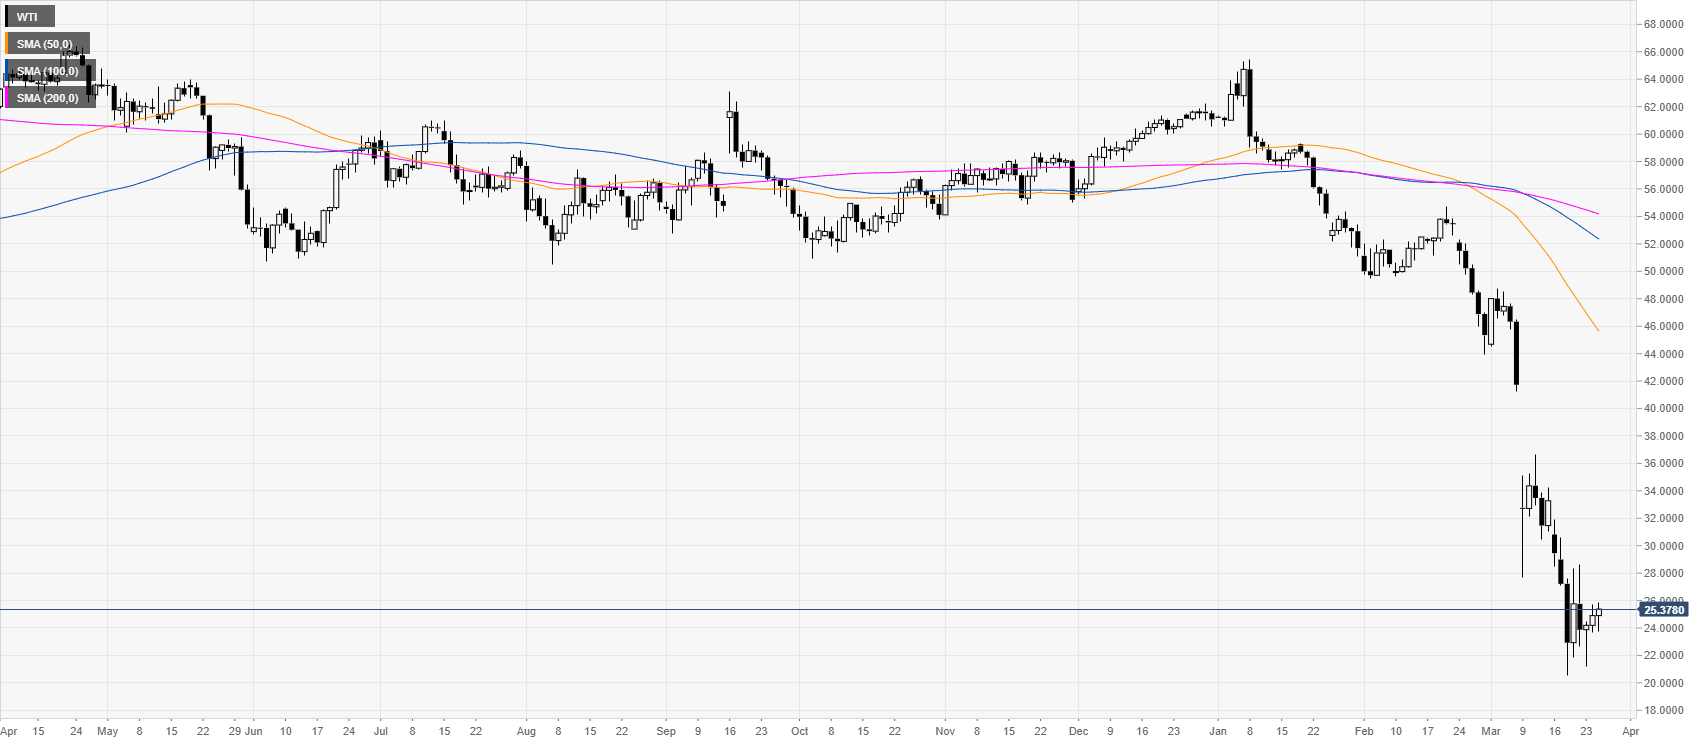
Oil daily chart
WTI collapsed violently in the last two months as WTI collapsed to its lowest level since February 2002 near $20 per barrel.
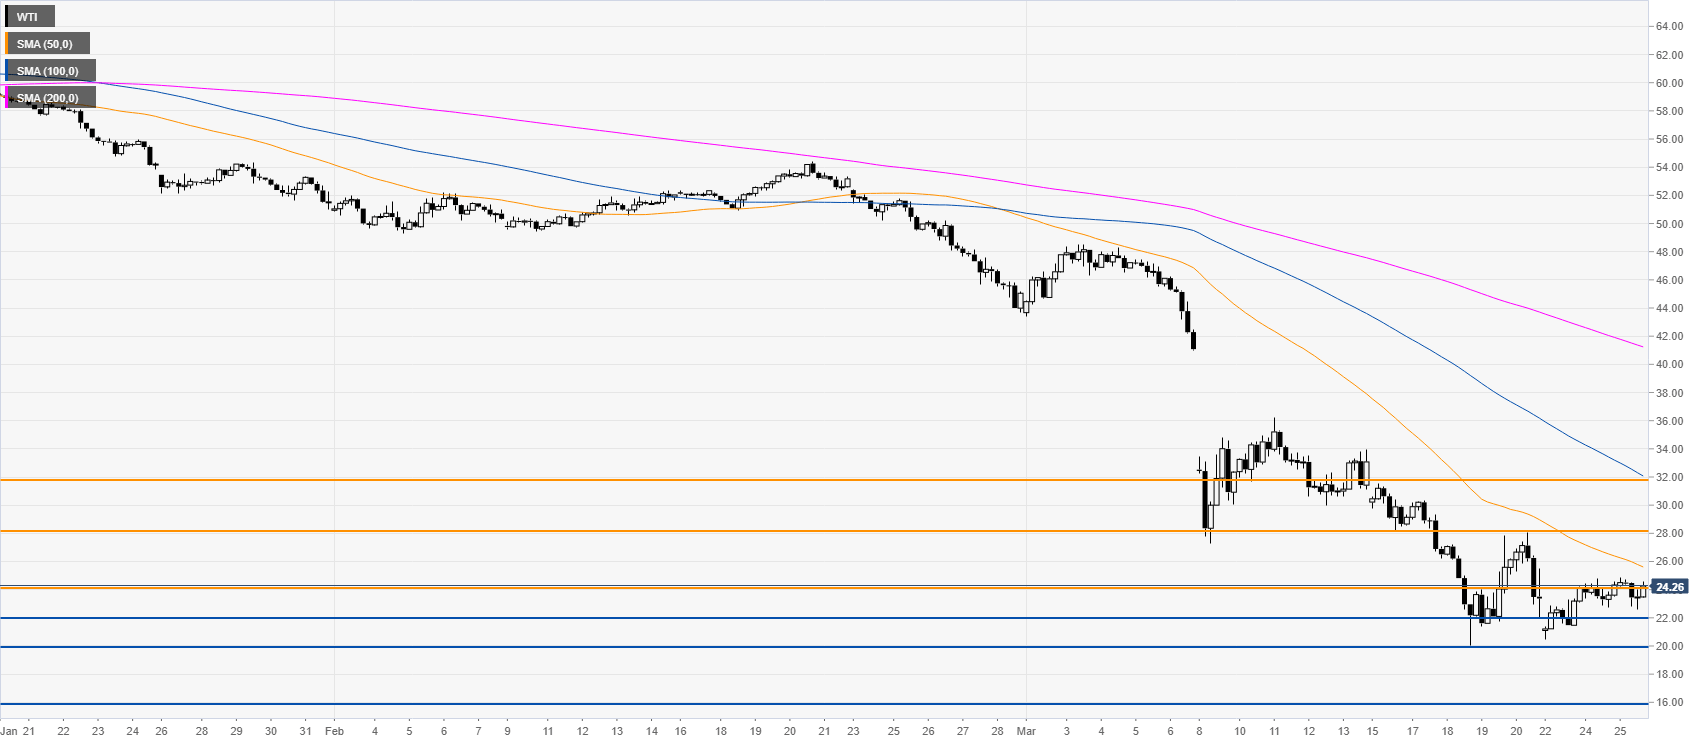
Oil four-hour chart
The oil market remains under selling pressure below its main SMAs as sellers are looking for an extension of the selloff below the 22/20 support zone wich would introduce scope to the 16 level on the way down. On the flip side, buyers would try to gather strength above the 24 resistance with potential targets to the 28 and 32 price levels on the way up.
Additional key levels