Back
13 Mar 2020
Gold Price Analysis: XAU/USD tumbles to fresh 2020 lows amid stock market crash, nearing $1500/oz
- XAU/USD is about to end the London session near 2020 lows.
- Further weakness could be expected in the short term.
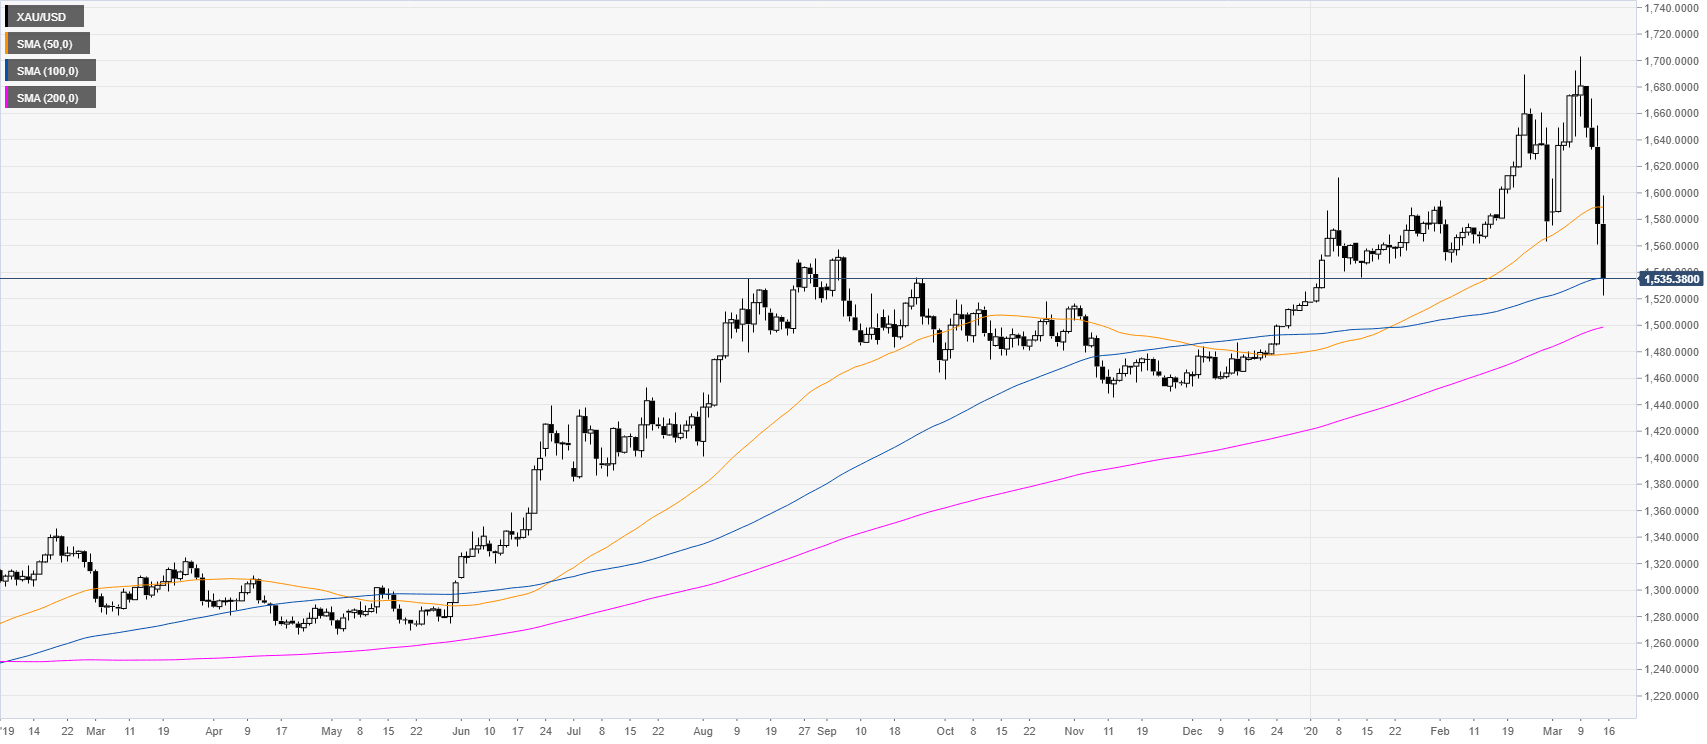
XAU/USD daily chart
Gold is trading in a bull trend above the main SMAs however the metal is retracing down sharply from the 2020 tops, now challenging the 1540 level and the 100 SMA on the daily chart. Gold is trading down as stock markets worldwide suffered one the worst week in history.
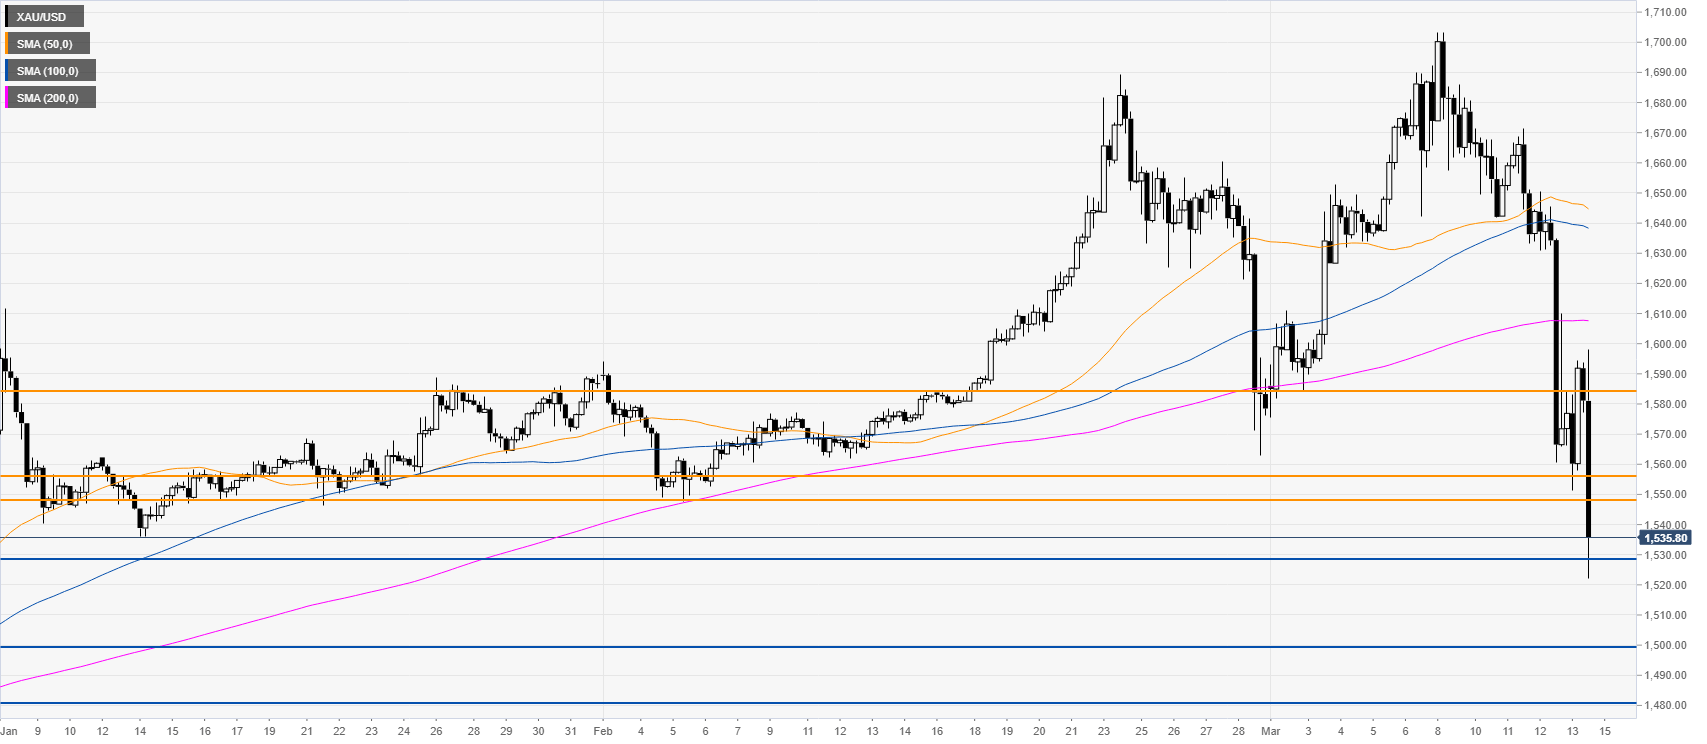
XAU/USD four-hour chart
The precious metal broke below the 1548/1557 support zone and the main SMAs on the four-hour chart. As bears are in control the metal could potentially extend losses towards the 1500 and 1480 levels. Resistance can be expected in the 1548/1557 price zone.
Resistance: 1548, 1557, 1585
Support: 1530, 1500, 1480
Additional key levels