Back
5 Mar 2020
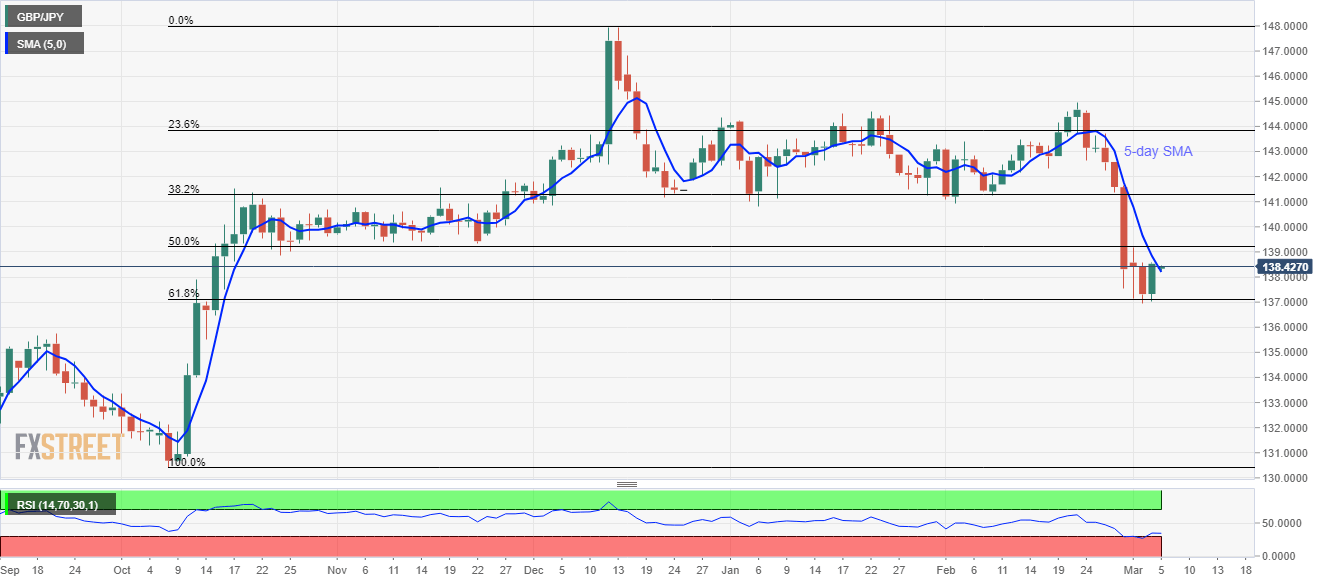
GBP/JPY Price Analysis: Extends pullback from 61.8% Fibonacci, clears 5-day SMA
- GBP/JPY remains positive while holding recovery gains from the multi-week low.
- 50% Fibonacci retracement, November 2019 low add to the resistance.
- A downside below 61.8% Fibonacci retracement highlights September 2019 high as the key support.
GBP/JPY rises 0.14% to 138.53 during the Asian session on Thursday. With this, the quote manages to extend its U-turn from 61.8% Fibonacci retracement of October-December 2019 upside while also clearing 5-day SMA.
That said, buyers are now looking towards 50% Fibonacci retracement and November 2019 low, respectively around 139.20 and 139.35, as immediate upside targets.
However, multiple barriers around 140.00 and 140.70 could challenge the bulls past-139.35.
On the downside, the pair’s declines below 61.8% Fibonacci retracement level of 137.10 can drag the quote to September 2019 high of 135.75.
GBP/JPY daily chart
Trend: Pullback expected