US equity indexes close broadly higher on Wednesday ahead of Thursday’s US CPI print
- US stocks printed in the green on Wednesday, led by megacap and tech gains.
- Nvidia hits a record high, while Meta and Alphabet post 12-month gains.
- Investors are leaning bullish in the run-up to Thursday’s US CPI inflation reading.
The overwhelming majority of US equity indexes closed in the green on Wednesday, fueled in large part by record-setting highs in chipmaker Nvidia, while Facebook owner Meta and Google operator Alphabet both posted 12-month highs through the day. Tech and megacap gains led broader indexes deeper into the green, and investors will be pivoting towards Thursday’s upcoming US Consumer Price Index (CPI) inflation print.
Equities have clawed back most of the losses seen at the outset of 2024 following a stellar ramp-up in market bets that the Federal Reserve (Fed) would get pushed into a faster and deeper pace of rate cuts in 2024, with money markets pricing in upwards of a 90% chance of rate cuts coming as soon as March.
The first US Nonfarm Payrolls of 2024 splashed cold water on market expectations as a still-firm labor market in the US keeps odds of impending rate cuts much lower than the market buildup was hoping for, sending market bets of a first cut in March back down to a reasonable but still hopeful 60%.
US CPI Preview: Forecasts from 10 major banks
Despite broad-market hopes, market forecasts see the headline US CPI inflation print for December to come in at 0.2% MoM compared to November’s print of 0.1%. Annualized US CPI inflation through December is likewise expected to tick slightly higher from 3.1% to 3.2%, while Core MoM CPI is expected to hold steady at 0.3%.
With investors hoping for signs of easing long-term inflation to kickstart the next rate cut cycle, markets will be focusing on annualized Core CPI through December, which is forecast to slightly decline from 4.0% to 3.8%.
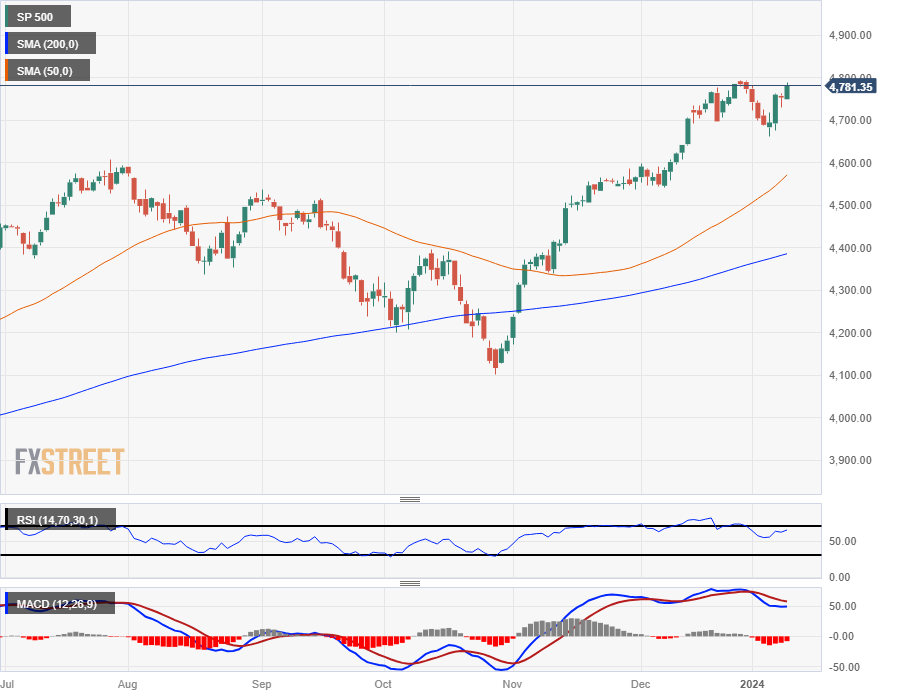
S&P 500 Technical Outlook
The Standard & Poor’s 500 (S&P) major equity index is back within touch range of late December’s 22-month high of $4,794.65, and is one good push away from setting new all-time highs beyond 2021’s peak bids of $4,812.38.
The S&P has muscled its way back over the 200-hour Simple Moving Average (SMA) just above $4,740.00, set for a challenge of the $4,800.00 handle with the index clawing back almost all of 2024’s early declines. The S&P bottomed out near $4,680.00 after a 2.75% decline from late December’s peak, and has rallied into the top end once more.
S&P 500 Hourly Chart

S&P 500 Daily Chart

S&P 500 Technical Levels
