


Advantages of horizontal analysis
Disadvantages of horizontal analysis
How to perform horizontal analysis
Horizontal analysis is a technique for evaluating financial data across diverse timeframes. This method allows traders to turn raw numbers from financial statements and charts into valuable trading insights. Today, we will delve into horizontal analysis and examine its key features and applications.
Horizontal analysis is a method that helps track changes in financial information over time. Imagine you want to see how a currency is doing—whether it's increasing or losing value. This method allows traders to assess fluctuations by comparing financial data—such as exchange rates or stock prices—over specific timeframes, such as months or years. By calculating the percentage change for each data point, traders can measure how much a financial indicator has increased or decreased compared to a previous period, making it easier to identify trends.Horizontal analysis: meaning
|
|
Period 1 (Base) |
Period 2 |
Change |
% Change |
|
Line-item 1 |
4800 |
7500 |
2700 |
+56% |
|
Line-item 2 |
2400 |
1900 |
-500 |
−21% |
In the table above, each period line item is compared to the same line item in the base period. For example:
1900 − 2400 = −500
(−500\2400) × 100% = −21%
For example, if traders use this approach to examine the exchange rate of a currency pair from 2023 to 2024, they can track whether its value has been increasing or decreasing. This helps them identify trends and make better decisions about when to buy or sell.
Horizontal analysis is also known as time-series analysis. Some sources refer to it as trend analysis, but it is a broader concept that includes other methods. Instead, trend analysis can be seen as one part of horizontal analysis.
Here are the main characteristics of horizontal analysis:
| Feature | Meaning |
| Comparative approach | Involves examining financial data from different timeframes, typically annually or quarterly. By comparing these figures, we can identify whether financial performance has increased or decreased over time. |
| Changes in percentages | Shows the calculation of changes in absolute figures and percentages for a clearer perspective on the scale of the change relative to the original figure. |
| Time span | Covers various timeframes, but it often implies year-over-year (YoY) or quarter-over-quarter comparisons to spot cyclical patterns, seasonal impacts, or long-term trends. |
Traders can identify patterns by looking at past price movements, especially at specific points where prices stop, bounce back, or change direction. These zones are known as support and resistance levels.
Support levels act like a price safety net, where buying interest is strong enough to keep prices from falling further. On the other hand, resistance levels serve as barriers that prevent prices from rising further. Knowing where these levels are, traders can forecast future price movements.
When prices move within a fixed range between support and resistance, the market is in a consolidation or accumulation phase, meaning there is no clear trend. However, if the price breaks through a resistance level or falls below a support level, it can signal a significant shift in market sentiment. Such breakouts often lead to new trends, showing that the balance between buyers and sellers has changed. By recognising these zones, traders can better position themselves to make thoughtful decisions based on historical behaviour.
Here are key metrics crucial in this type of analysis:Horizontal analysis metrics
Metric
Meaning
Price movement over time
Tracks how a currency pair’s price changes within a set timeframe. For example, checking the EURUSD price at the start and end of the month shows how it has moved.
Percentage change
Indicates how much the price has risen or fallen compared to its starting value, helping to measure the significance of the movement.
Trading volume
Shows how many units of a currency pair were traded during a specific timeframe. High trading volume often signals strong interest or activity.
Moving averages
Smoothes out price data to identify trends over time. For instance, a 50-day moving average takes the average price of a currency pair over the last 50 days. If this average is rising, it suggests that prices are generally increasing.
Historical highs and lows
Tracks the highest and lowest prices a currency pair has reached over a specific timeframe. These levels can serve as key reference points for traders.
The formula for horizontal analysis is:Horizontal analysis formula
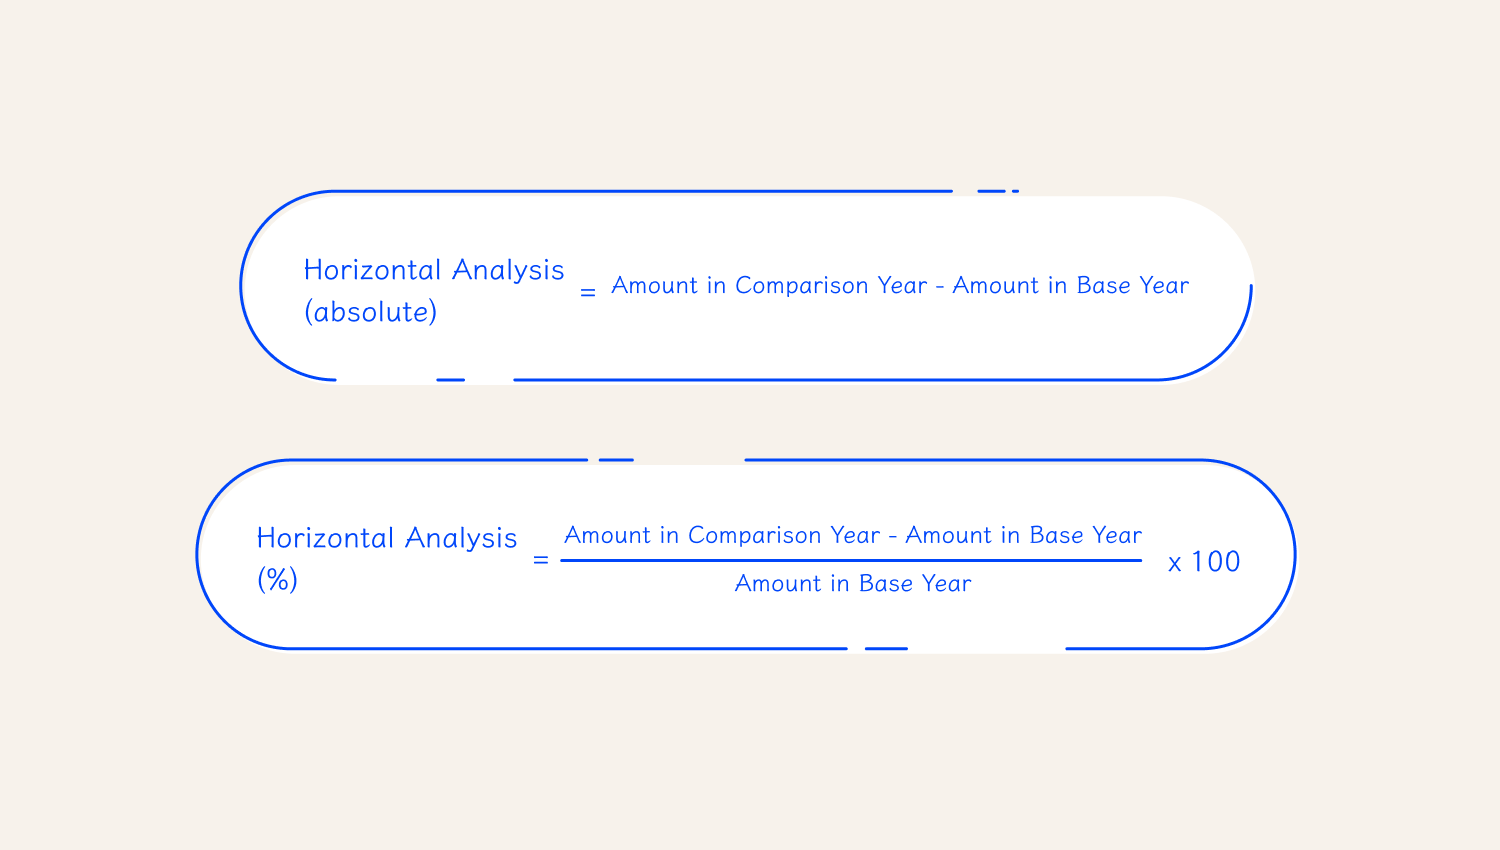
The horizontal analysis formula calculates how much the exchange rate has changed over a specific timeframe. For example, If EURUSD starts the month at 1.10 and ends at 1.15, the euro has strengthened against the dollar. To understand the significance of the price movement, we calculate the percentage change.
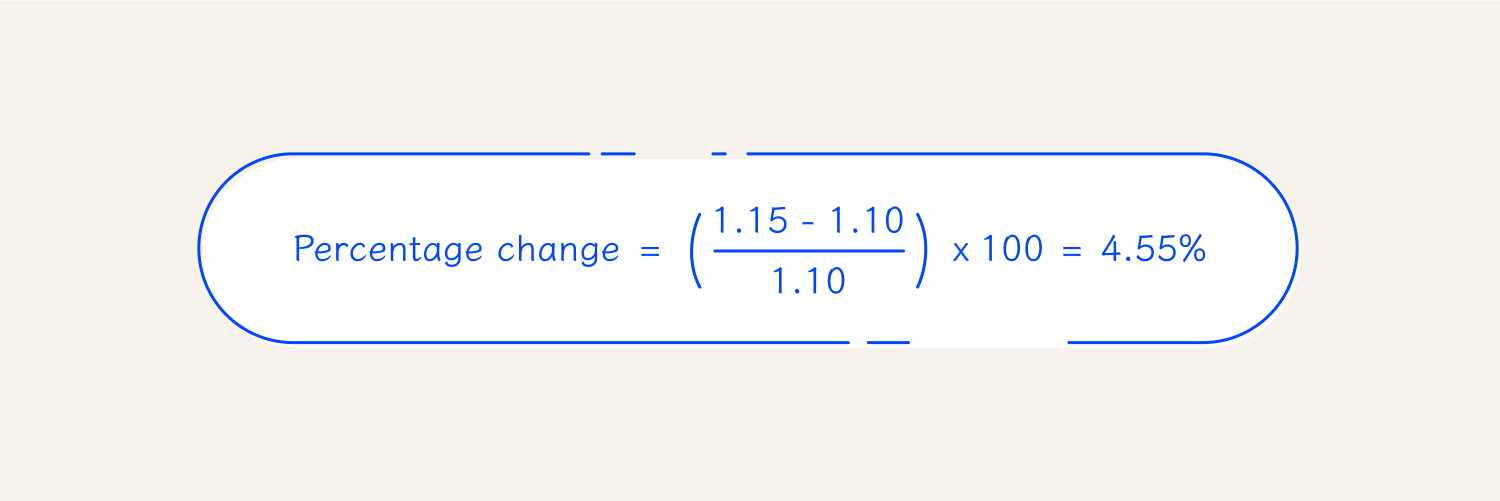
This means the euro increased in value by about 4.55% against the dollar over the month.
Advantages of horizontal analysis
For instance, if analysis only shows the best months instead of an entire year, it might mislead you about how well an investment is doing. Always use the same timeframes when comparing data. If any changes are made to what's being compared, those should be clearly stated.Disadvantages of horizontal analysis
Let's analyse the EURUSD exchange rate over three weeks: Week 1: 1.1000 Week 2: 1.1050 Week 3: 1.1100 To calculate the percentage changes, let's identify the timeframes we need to focus on: from week 1 to week 2 and from week 2 to week 3.Example
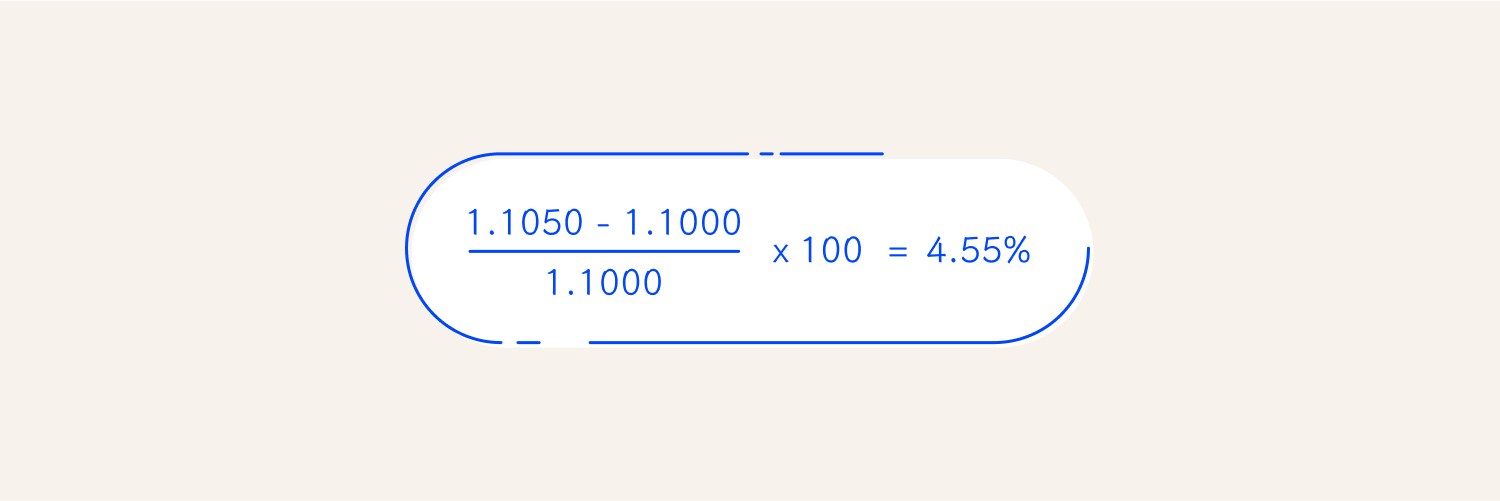
This shows an increase of 4.55%.
- From week 2 to week 3. We use the same formula to calculate the percentage increase.
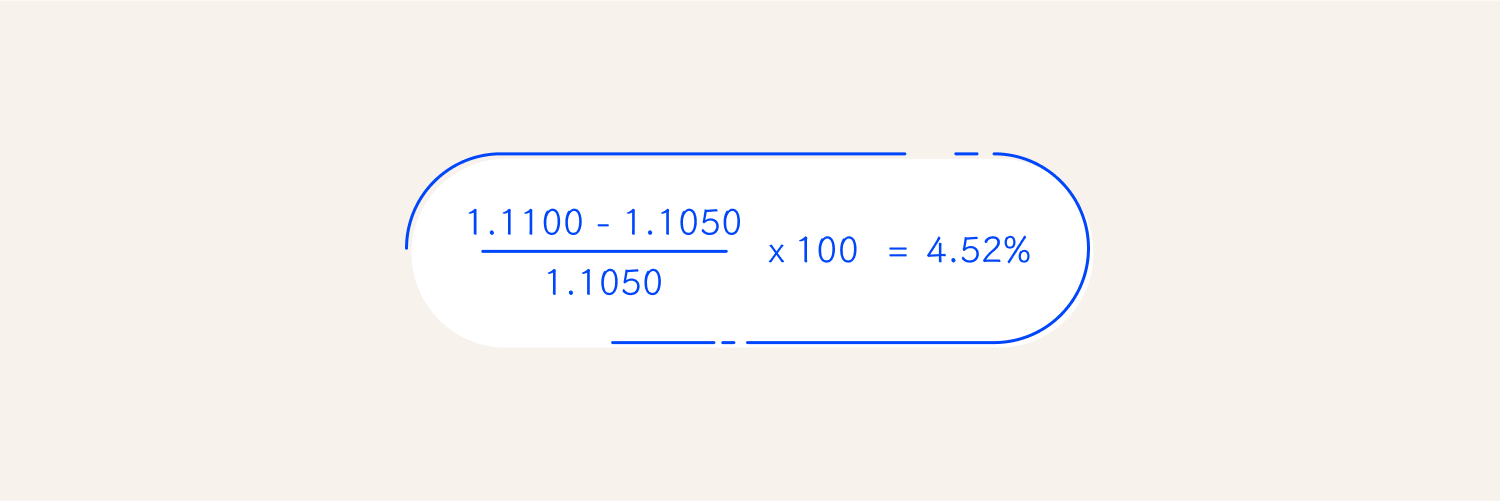
This indicated an increase of 4.52%.
Below is another example of Horizontal analysis:
| 2019 | 2018 | ||
| Net Sales | $800,000 | $750,000 | 800,000/750,000= 106.67% |
| Cost of Goods Sold | 375,000 | 355,000 | 375,000/355,000 =105.63% |
| Gross Profit | 425,000 | 395,000 | 425,000/160,000=107.59% |
| Operating Expense | 140,000 | 160,000 | 140,000/160,000=87.5% |
| Net Income | 285,000 | 235,000 | 285,000/235,000=121.28% |
1. Collect price data 2. Choose an analysis methodHow to perform horizontal analysis
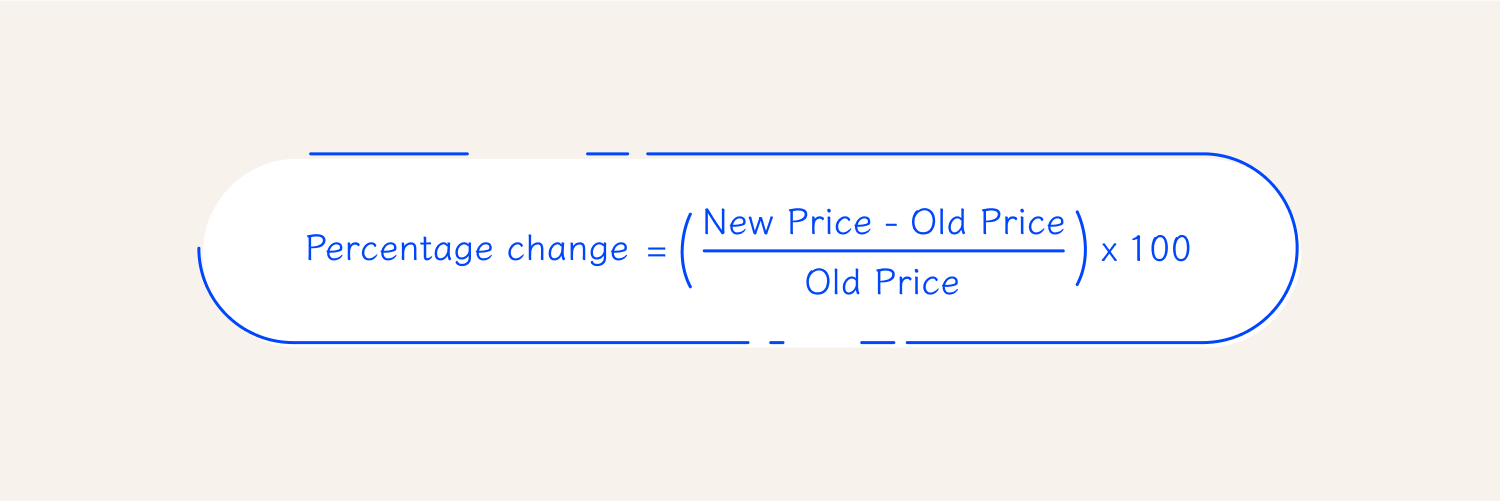
(1.15 – 1.10/1.10) × 100 = 4.55%
This means the euro has appreciated by about 4.55% against the dollar over that timeframe.
Now that you have analysed the data, it's time to look for trends and patterns. Ask yourself specific questions to guide your analysis:
- How did EURUSD respond to economic news over the last six months?
- Does the currency pair strengthen after certain economic reports like employment data or GDP growth?
- Does the currency weaken during specific geopolitical events?
Look for recurring patterns to understand how external factors influence price movements. This insight can help refine trading strategies and improve decision-making.
Final thoughts
